Performance
9 Facebook Ads KPIs You Must Be Tracking in 2023
Tracking

Charles Mai Lam
Feb 20, 2023
After benchmarking articles online about Facebook reporting, we sadly observed that while most of them list out KPIs and define what they each mean, we haven't seen any that actually explains rationally why those KPIs have been chosen in the first place and how to concretely use them.
Behind this catchy click-baity title, we intend to bring this missing deeper and concrete view of how measuring KPIs on Facebook Ads can help you make better decisions for your campaigns. More than the KPIs that our team at Back-to-Back Agency are following, we'll walk you through the relationship between them and our process in analyzing our performance to make the best rational decisions for your campaigns.
Throughout this article, we will use the analogy of an events company like Live Nation, one of the leaders in entertainment, trying to promote their next event to explain how Facebook Ads work. We will focus on how they measure their performance with one marketing channel: flyers distribution.
Tracking:
Our process always starts with a thorough analysis of what tracking has been implemented by our clients. Indeed, we want to make sure that the Facebook pixel has been set up properly on the website so that it passes down all valuable information to Facebook.
Which KPIs to follow?
Volume:
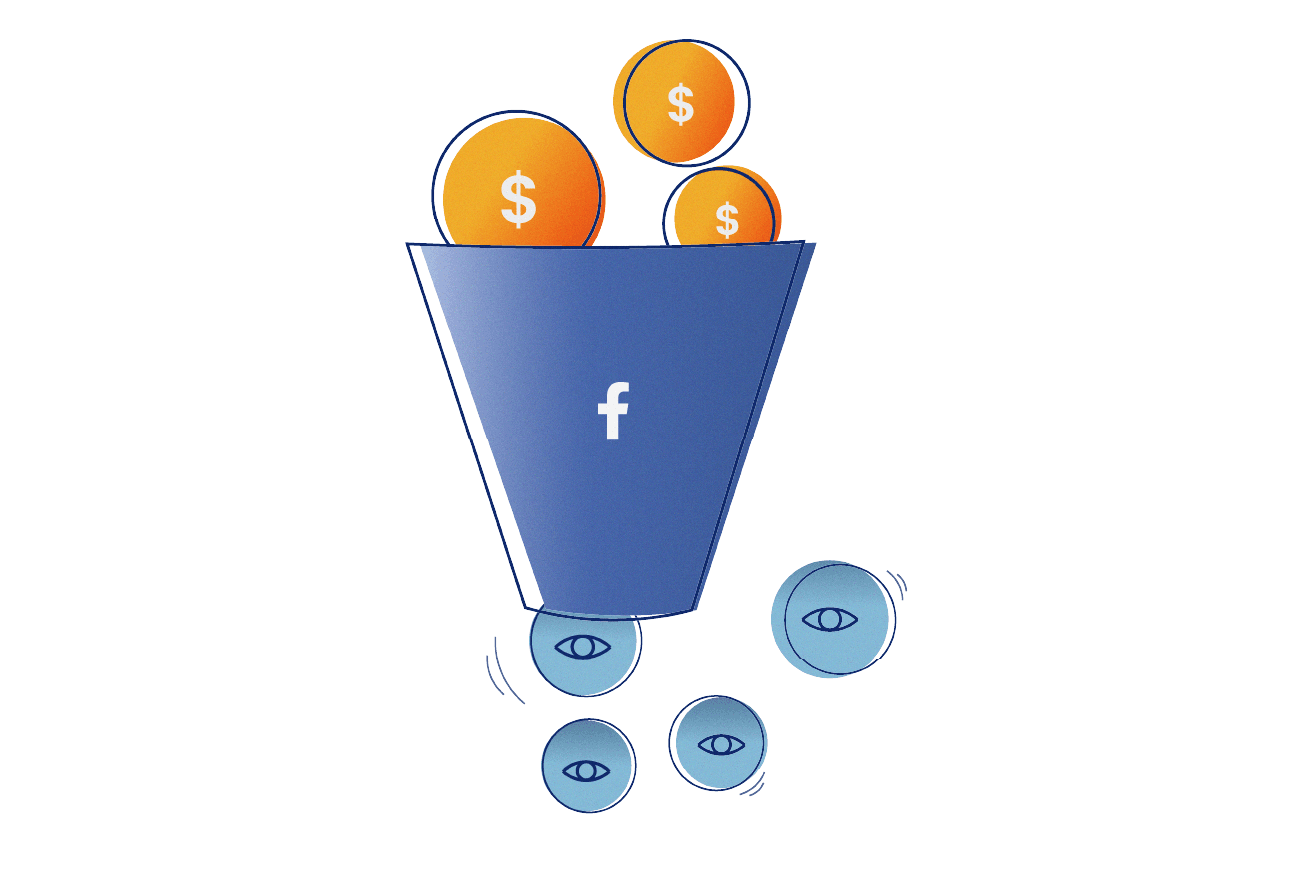
To start with, Facebook Ads is an advertising platform that enables you to buy advertising space, and impressions. The more investment, the more impressions you get. Pretty much like when you print flyers, the more money you invest, the more flyers you are to distribute to advertise your brand. The more impressions you get, the more chances you get to generate interest (clicks). And finally the more clicks, the more leads/sales you can get. Simply put by using the same analogy
Cost: How much investment did you spend on the platform?
= How much did you pay the print shop for flyers + how much for distribution?
Impressions: How much advertising space did you manage to get from the investments?
= How many flyers were actually printed out and distributed?
Clicks: How many clicks did you generate?
= How many people showed interest in your product/service by actually interacting with it (calling a phone number that you displayed on it, scanning a QR code, or visiting your website depending on what CTA you put on your flyer)?
Leads/Sales: How many people ended up buying your product/service?
= How many people came to your event thanks to your flyers?
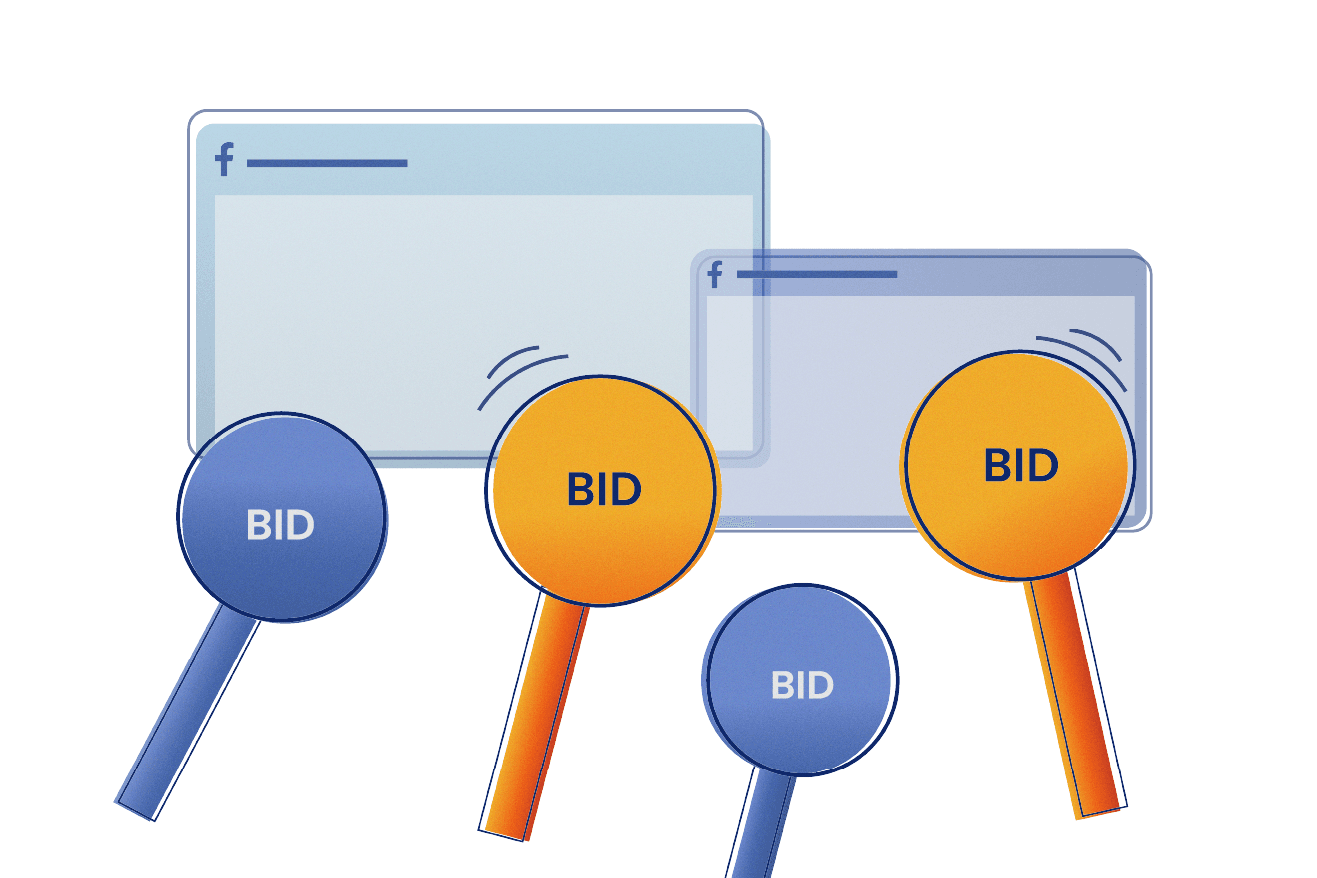
Average cost:
In order for you to buy ads on Facebook Ads, you need to go for auctions. Indeed, the market evolves constantly with new competitors on the market, with different demands for your product/service. The cost you will end up paying depends on the offer and demand:
Offer to the number of available advertising spaces and how valuable the people you are targeting are,
Demand represents the actual other competitors bidding against you to get those advertising space.
In the context of your flyers:
Cost Per 1000 Impressions:
How much it costs for you to print and distribute the flyers? Bear in mind that this metric is dictated by the market as the more advertising space available, the easier for you it gets to compete to gain advertising space and therefore the cheaper your CPM. The CPM is also dictated by the demand for your flyer: depending on which format, which paper quality, the colors, the price of the flyer will vary.
Cost per Click:
How much it costs you to generate interest for your service/product.
Cost per Lead / Cost per Transaction:
On average, how much it costs you in terms of flyers printed and distributed in order to generate one sale and one lead.
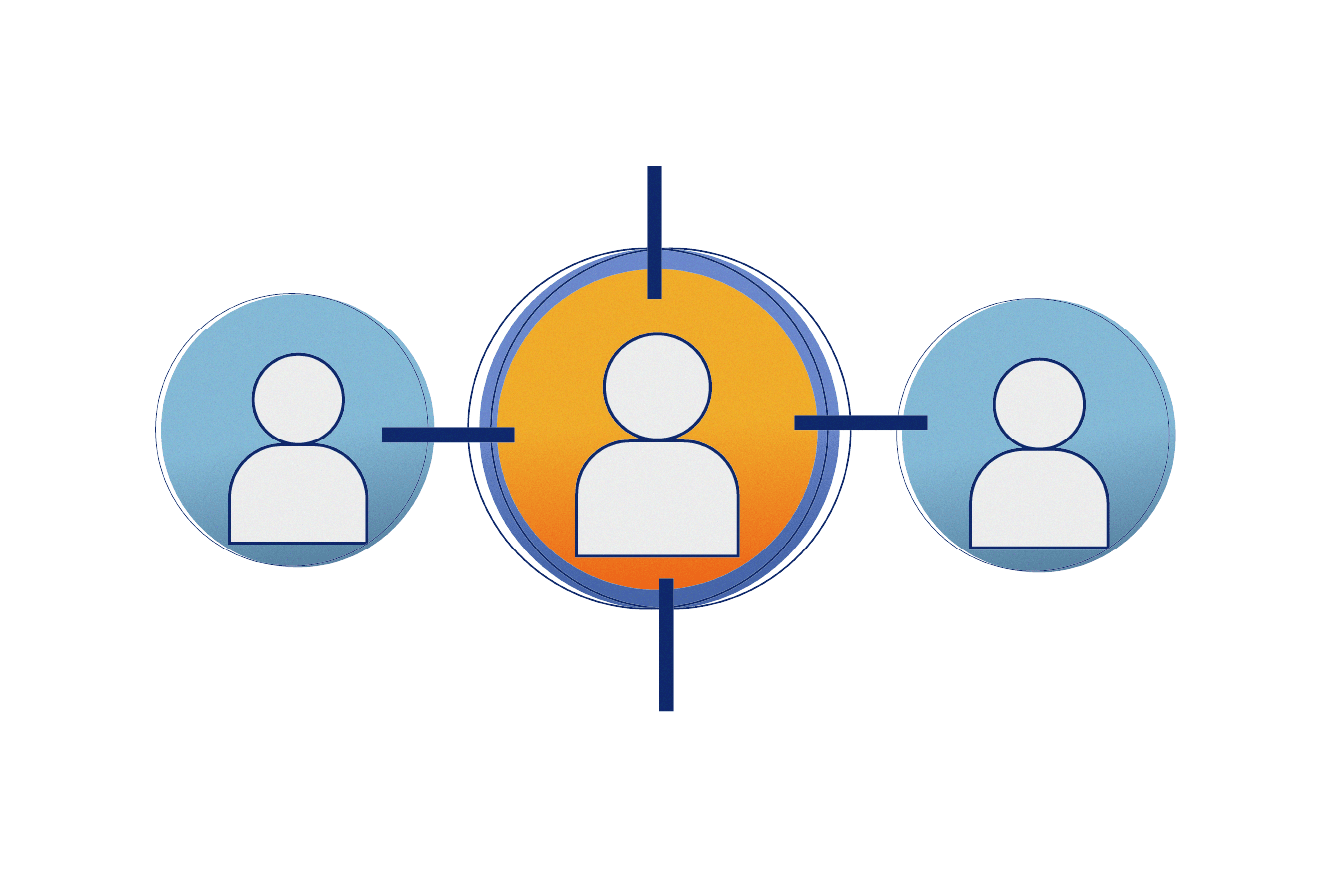
Assets Efficiency:
Buying advertising space is one thing, making them efficient is another one. While your impressions are mostly dictated by the investments you are putting into Facebook Ads, there is still a need for you to assess how efficient your ads and landing pages are at addressing the targeted audience. Introducing Click-Through Rate and Conversion Rate.
In general, the higher your CTR and CR, the better. But those metrics are not independent of each other as better efficiency doesn't mean you will have more conversions and vice-versa.
Click-Through Rate (CTR): Click-through rate measures your ad efficiency. It is the ratio between clicks generated over impressions.
= How many people actually grabbed your flyer (without throwing it in the trash directly) and decided to know more about it?
Conversion Rate: Measures your landing page efficiency and how it manages to convince your users to buy/sell.
Other KPIs linked to your business: ROAS, Deals, CPD.
Depending on the business and industry you are in, KPIs like the Return On Ads Spent, the Deals, and the Cost per Deal is a definite must for you to monitor. While you could be optimizing your campaigns for maximizing leads or conversions, the actual return is a step deeper in the analysis of your performance, and also helps in identifying the best practices in terms of strategy for your Facebook campaigns.
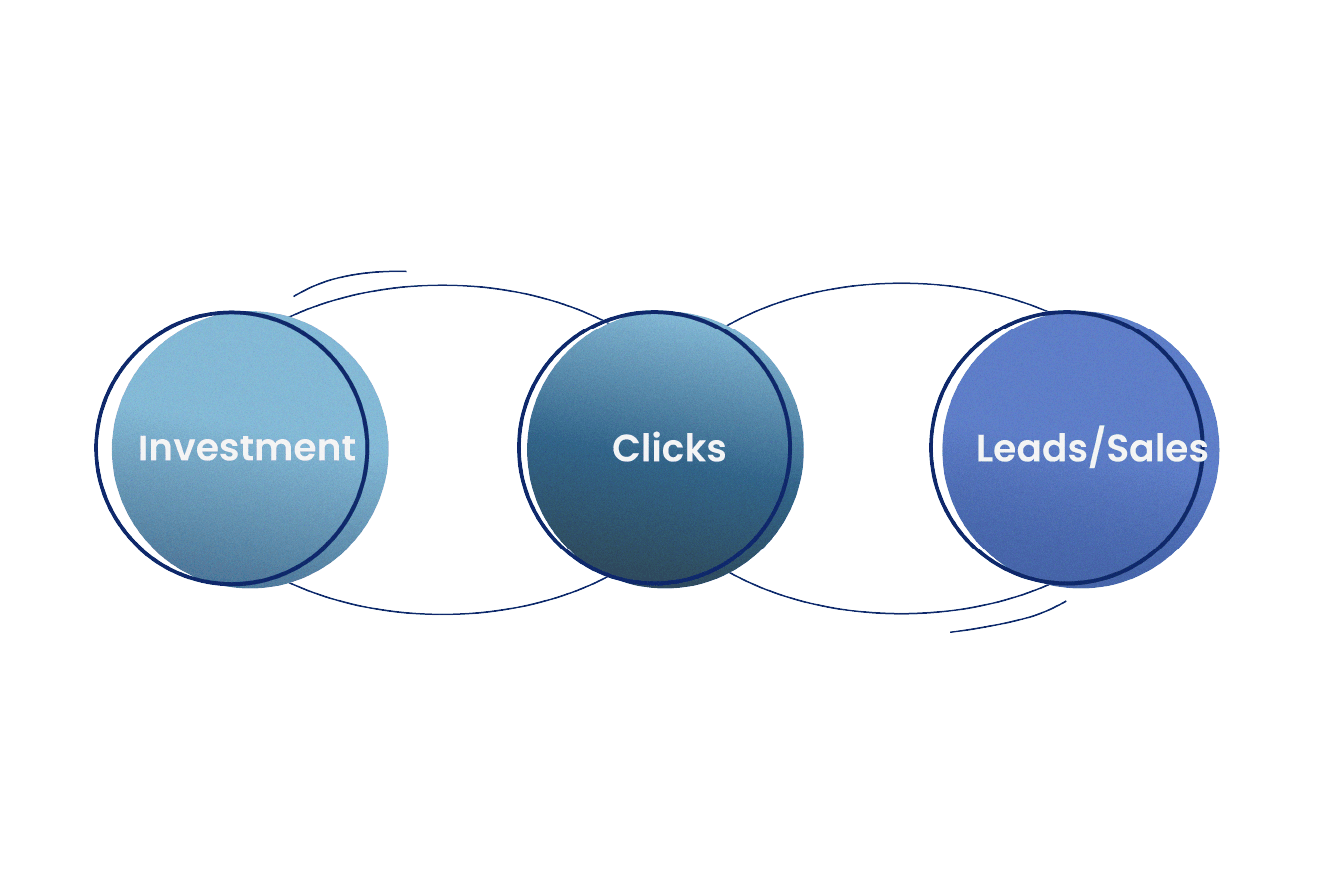
Relationship between those KPIs:
As you might have understood from the previous section, all those KPIs are related to each other and have direct relationships. In this section, we will look at those relationships in order to better assess the next actions for your campaigns.
Here's the table we're using for our reports at Back-to-Back Agency:
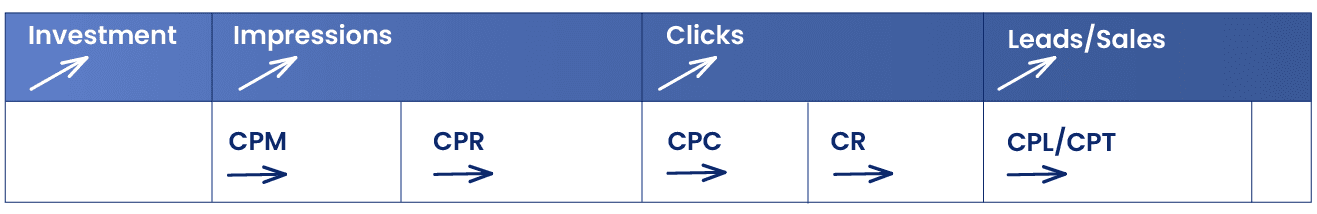
From left to right, the investment, the impressions, the clicks, and the conversions. Indeed, without any investment, you cannot generate impressions, without impressions, you cannot generate clicks, without clicks you can't generate conversions while all other KPIs remain the same. As simple as that.
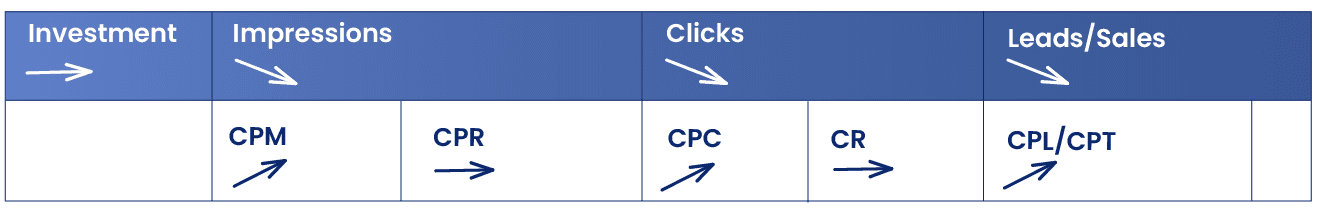
But the volume you're generating is not only linked to the amount of investments. As we mentioned earlier, the average cost depends on offer/demand. As competition increases for advertising space, your CPM will likely increase and directly impact your number of impressions. And as stated in the previous paragraph, less impressions means less clicks, and naturally less conversions. All things remaining equal, the increased CPM impacts the CPC and cost per lead directly, from left to right.
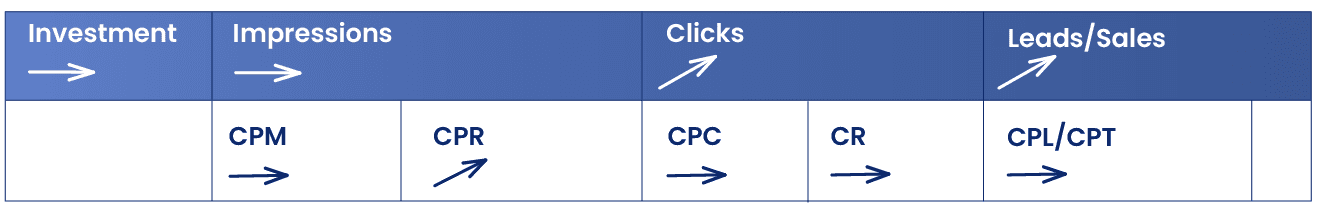
CTR and CR independence:
CTR and CR are also directly impacting your metrics and should be analyzed thoroughly. Indeed, as you try new ads, the edits you made will have a direct impact on your CTR. As you make changes to your landing page, you will impact your CR. Higher CTR with all things remaining equal means more traffic for your website. Higher CR means more conversions for you.
But CTR and CR are independent of the level of investments you make.
Now that you know all of this, you are armed with the KPIs to be analyzing your performance! Analyze how your KPIs interact with one another.
So you can start testing out:
Test some new ads and/or your target audience to see how it benefits your CTR.
Make changes to your investments and see how they naturally should impact your volume while maintaining your average costs.
Identify what are your success factors and what needs improvements.
Analyze how your KPIs evolve over time.
"All things remaining equal":
The nature of Facebook Ads makes it so that you will likely see inverse relationships between your KPIs. While there's a natural course of action and relationship between KPIs, the reality is different:
Ads' offer is constantly evolving as Facebook's number of active users changes over time, as they introduce new ad placements.
The competition also continuously changes as your rivals might increase/decrease their budgets, and come up with new offers.
Seasonality can also impact Facebook users' behavior as well as competition.
Your target audience might be very scarce and therefore difficult to reach.
A new algorithmic update might also directly impact your performance over time.
This is key to extracting the information behind your KPIs evolution, and this is the work we do on a continuous basis for our clients at Back-to-Back Agency. Being able to tell what works from what doesn't while making sure that we take into account external factors in our equation.
Join the talk!
Stay on top of digital marketing innovation thanks to the insights from our internal Slack.
We post everyday!